User Interface 
Qat’s User Interface is divided into two main components:
Application Manager: Allows you to register and configure applications to use with Qat.
Spy Window: Displays a hierarchical tree of all Qt elements within an application, along with their properties.
Table of contents 
Application Manager
To begin, navigate to the folder where your tests will reside, and enter the command:
qat-gui
This opens the Application Manager, where you can manage the applications used by Qat.
Adding an application
To register a new application, click the “Add” button: ![]()

Name (required): A unique name to identify the application, used in test scripts via functions like
qat.start_application(). If left empty when selecting the application path, it defaults to the executable name.Path (required): The full path to the application’s executable. On macOS, this could be the application bundle path (e.g.,
/Applications/MyApp). For PySide or PyQt applications, provide the path to the main Python script.Arguments (optional): Default startup arguments for the application, which can be overridden in test scripts.
Shared (optional): A shared application is accessible to all tests on the same machine. Otherwise, it is limited to the current test folder.
After completing the required fields, click “Save” to register the application. It is now ready for use in test scripts.

Editing an application
To modify a registered application:
Select it from the dropdown menu at the top-left corner.
Adjust the desired settings.
Click “Save” to apply the changes.
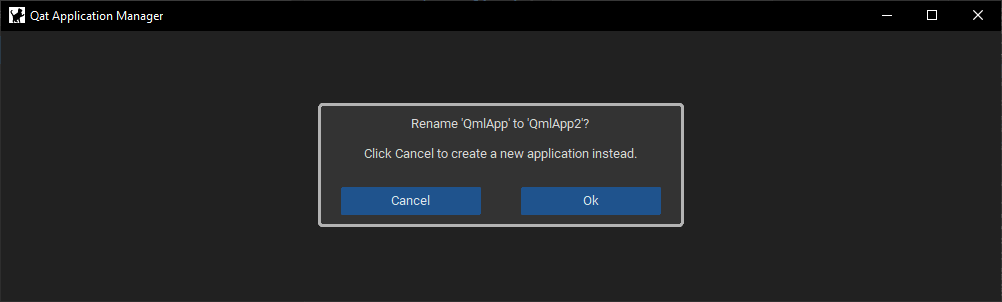
If you rename an application but leave its path unchanged, Qat will prompt you to either rename the existing application or create a new one.
To remove an application, click “Delete” ![]() .
.
Launching an application
Select an application and click “Start” ![]() . This will launch the application and automatically open the Spy Window (see below).
. This will launch the application and automatically open the Spy Window (see below).
Attaching to an application
If the application is already running, click “Attach” ![]() to open the Spy Window for the current instance.
to open the Spy Window for the current instance.
Spy Window
The Spy Window allows you to explore all Qt elements of an application, helping you identify appropriate properties for object definitions (e.g., objectName, id, or type) and debug test scenarios by viewing real-time application states.
Object tree
The tree on the left visualizes all elements with their parent-child relationships.
Note that some elements may appear multiple times due to the dual parent-child hierarchy in Qt (ownership and visual).
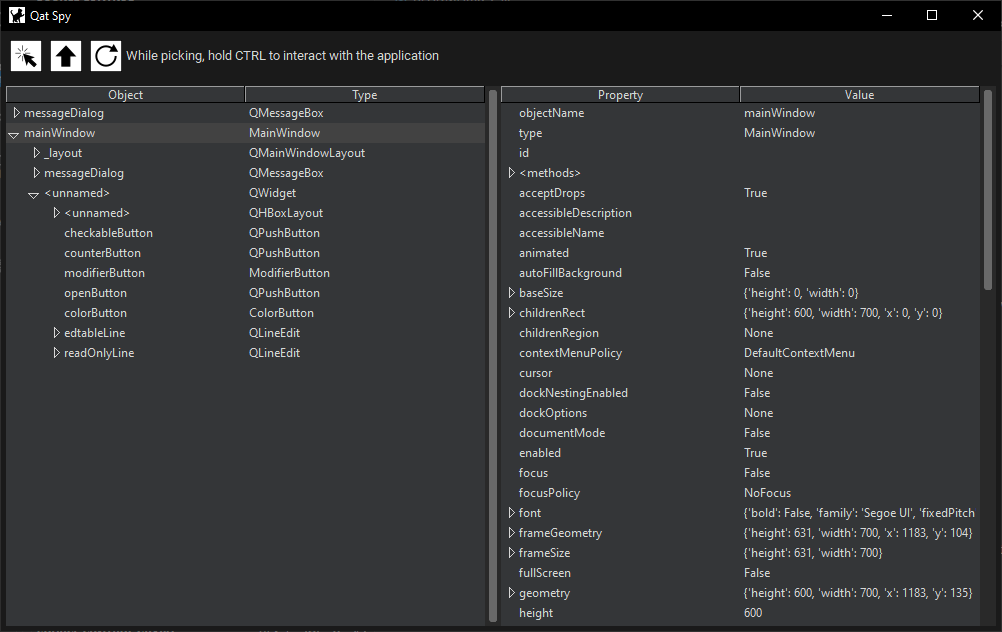
The tree’s root elements correspond to the application’s main windows (visible or not).
If windows are added or removed, click “Refresh” ![]() to update the view.
to update the view.
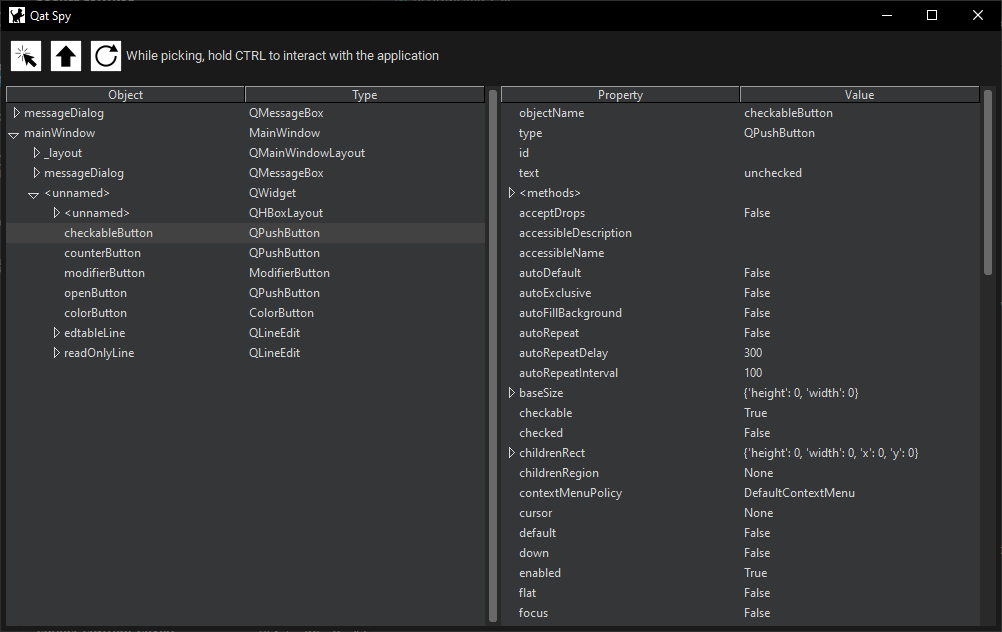
Selecting an element displays its properties and methods in the Properties Panel.
Properties Panel
On the right, the Properties Panel shows the names and values of the selected element’s properties:
The Properties Panel also shows the methods of the selected element, including signals and slots:
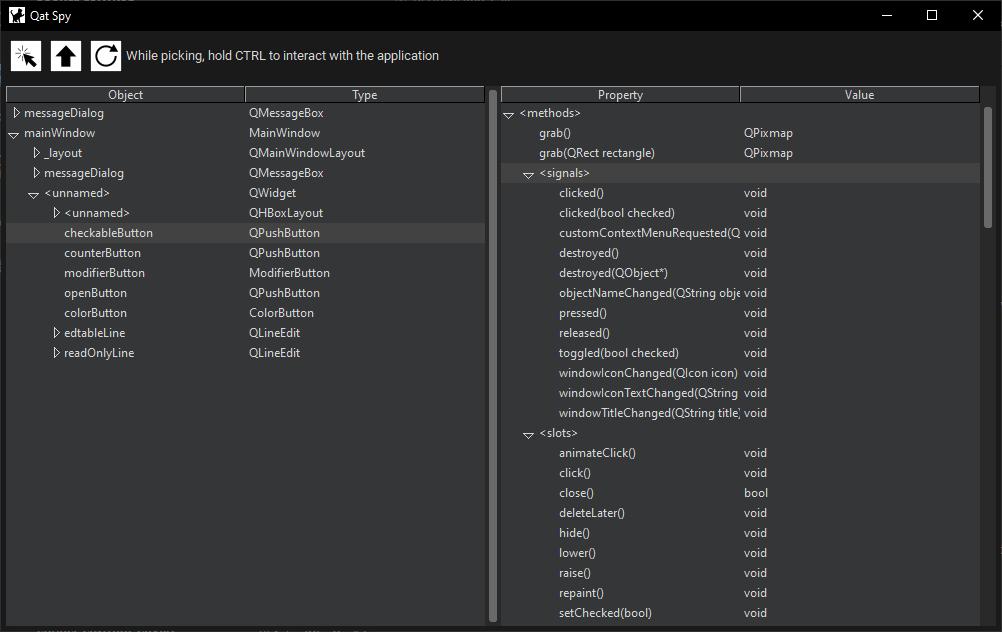
All displayed properties and methods are accessible through the Qat API in test scripts.
Object picker
The Picker ![]() tool overlays the application UI, highlighting widgets under the mouse cursor and displaying their
tool overlays the application UI, highlighting widgets under the mouse cursor and displaying their type, name, or id (if available).
Click a highlighted widget to select it in the Spy tree and view its properties.
The selected widget will appear at the root of the tree. Use the “Up” button
 to navigate to its parent.
To disable the picker, click “Picker” again ![]() .
.
While the picker is active, holding the Ctrl key temporarily disables it, allowing you to interact with the application (e.g., open a ComboBox before selecting an element).
Closing the Spy
To close the Spy Window and return to the Application Manager, either:
Close the application itself, or
Close the Spy Window directly.
If the application was attached using the “Attach” button, it will remain open if another process is still using it. Otherwise, the application will be closed.